prometheus 启航
在服务运行的整个生命周期内,为了尽早的发现服务内部的潜在问题,我们需要对于服务运行过程中产生的数据进行监控,并提取其关键指标,并在某项指标产生异常时触发报警。
我们熟知的监控系统,除了本文讲到的 prometheus 外,还有 zabbix。zabbix 跟 prometheus 的最大区别是,需要被监控方主动上报自己的数据给数据收集者;而 prometheus 需要程序的编写者自己暴漏 HTTP 接口,然后由数据采集者自己来做数据拉取。prometheus 采用这种主动拉取的策略,便可以从容的在数据采集端来控制数据采集的频率,一旦想做修改某个指标的频率只需要在采集端做一次修改,换成使用 zabbix 的话,需要修改每个上报端的程序配置才能完成。
加之,Prometheus 的社区中提供了各种数据暴漏的插件程序(在 Prometheus 体系中,它们被称之为 exporter),大大减轻了程序编写成本。很多常见的数据库或者中间件程序,都有编写好的 exporter 程序,可以使用,例如 Mysql Mongodb Redis Kafka Nginx 等都有成熟的 exporter 可以使用。
具体可以参见官方的 exporter 文档 https://prometheus.io/docs/instrumenting/exporters/
Prometheus 还有一个重大的特性,是其收集的数据有固定的数据结构,而这些数据结构可以通过自带的 PromQL 语句进行查询,返回聚合后的数据,更可以将 PromQL 和 grafana 结合,显示成报表视图。
由于 PromQL 比较复杂,本篇教程并不会过多涉及。
1. 安装
这里使用 docker-compose 来构建一个测试用的 Prometheus 环境
version: "3"
services:
  alertmanager:
    restart: always
    image: prom/alertmanager
    ports:
      - '9093:9093'
    volumes:
      - ./alertmanager:/etc/alertmanager
  prometheus:
    restart: always
    user: root
    image: bitnami/prometheus
    container_name: prometheus-dev
    ports:
      - '9090:9090'
    volumes:
      - ./prometheus:/opt/bitnami/prometheus/conf
      - /tmp/prometheus-persistence:/opt/bitnami/prometheus/data
    depends_on:
      - alertmanager
  grafna:
    restart: always
    image: grafana/grafana
    user: root
    volumes:
      - /tmp/grafana-persistence:/var/lib/grafana
    ports:
      - '3000:3000'
    environment:
       GF_SECURITY_ADMIN_PASSWORD: "secret"
    depends_on:
      - prometheus
代码 1.1 docker-compose.yml
在上述代码中,通过 volumes 属性指定了一个外挂的目录,Prometheus 默认从 /opt/bitnami/prometheus/conf/prometheus.yml 路径下加载配置,这里我们在 docker-compose.yml 文件所在目录下,创建一个 prometheus 目录做映射到 /opt/bitnami/prometheus/conf 目录,这样修改配置文件时,就只需要在宿主机上做修改即可,不需要进入 docker 内部。下面是 prometheus 目录下的 prometheus.yml 的配置内容
# my global config
global:
  scrape_interval:     15s # Set the scrape interval to every 15 seconds. Default is every 1 minute.
  evaluation_interval: 15s # Evaluate rules every 15 seconds. The default is every 1 minute.
  # scrape_timeout is set to the global default (10s).
# Alertmanager configuration
alerting:
  alertmanagers:
  - static_configs:
    - targets:
      - alertmanager:9094
# A scrape configuration containing exactly one endpoint to scrape:
# Here it's Prometheus itself.
scrape_configs:
  # The job name is added as a label `job=<job_name>` to any timeseries scraped from this config.
  - job_name: 'prometheus'

    # metrics_path defaults to '/metrics'
    # scheme defaults to 'http'.

    static_configs:
    - targets: ['localhost:9090']
代码 1.2 prometheus.yml
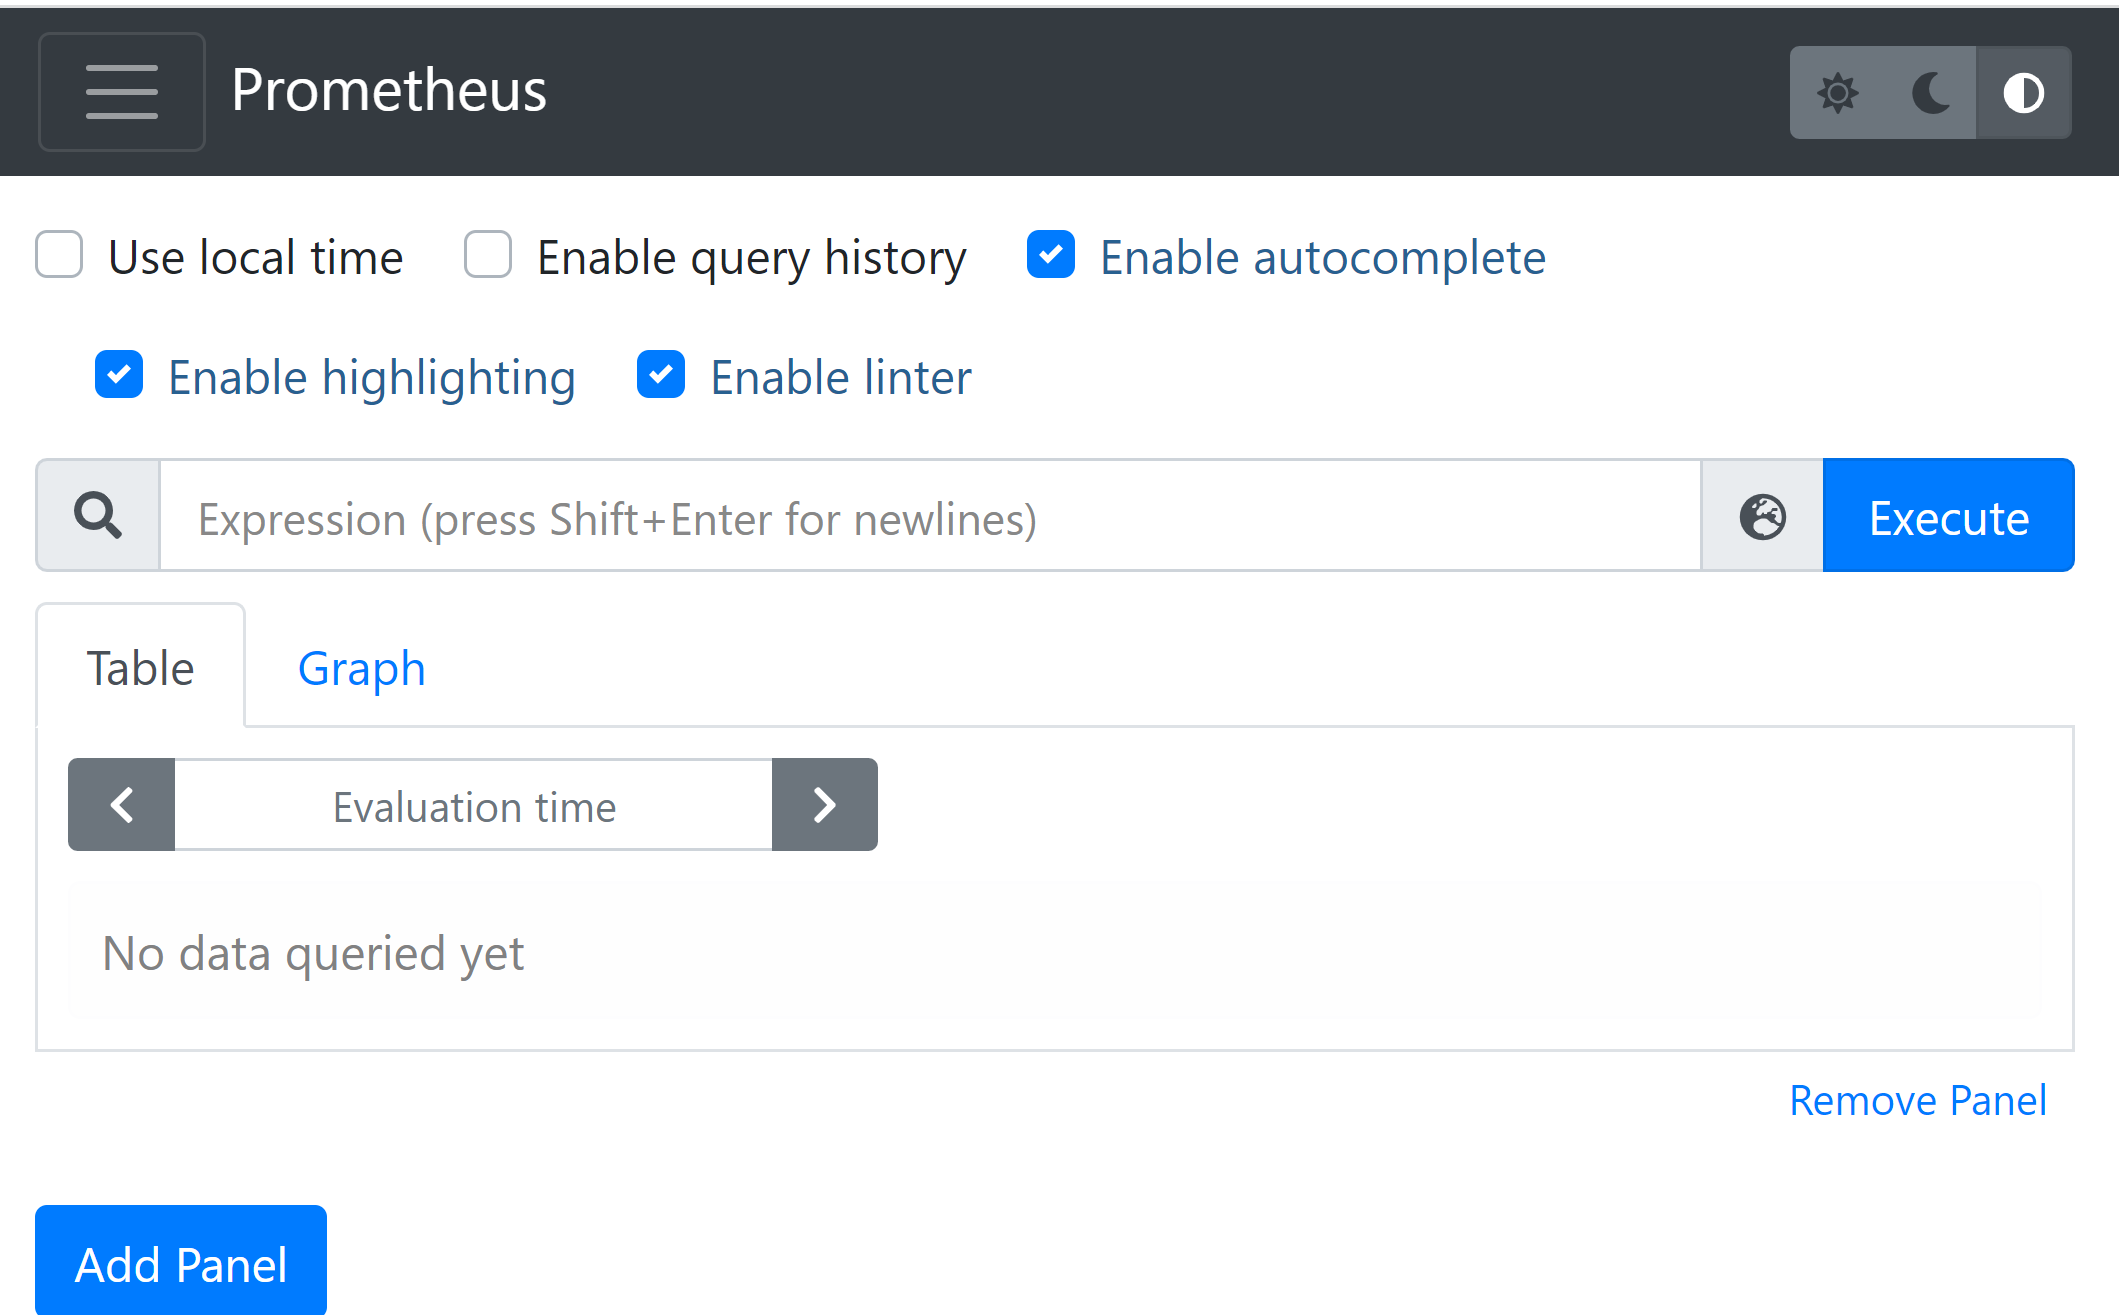
图 1.1
在浏览器中打开 localhost:9090,如果能显示上图界面,代表配置成功。
这里主要讲一下 代码 1.2 中的 scrape_config 属性。它里面配置的内容,就是我们前面中提到的各种 exporter,Prometheus 本身也提供了一个 exporter 采集地址,访问 http://localhost:9090/metrics 即可看到返回的采集数据。这里摘取返回的头部几行数据展示如下:
# HELP go_gc_duration_seconds A summary of the pause duration of garbage collection cycles.
# TYPE go_gc_duration_seconds summary
go_gc_duration_seconds{quantile="0"} 1.95e-05
go_gc_duration_seconds{quantile="0.25"} 5.42e-05
go_gc_duration_seconds{quantile="0.5"} 0.0001787
go_gc_duration_seconds{quantile="0.75"} 0.0002019
go_gc_duration_seconds{quantile="1"} 0.0003965
go_gc_duration_seconds_sum 0.0008508
go_gc_duration_seconds_count 5
# HELP go_goroutines Number of goroutines that currently exist.
# TYPE go_goroutines gauge
go_goroutines 35
# HELP go_info Information about the Go environment.
# TYPE go_info gauge
go_info{version="go1.17.5"} 1
# ......此处省略若干条记录......
# HELP promhttp_metric_handler_requests_total Total number of scrapes by HTTP status code.
# TYPE promhttp_metric_handler_requests_total counter
promhttp_metric_handler_requests_total{code="200"} 543
promhttp_metric_handler_requests_total{code="500"} 0
promhttp_metric_handler_requests_total{code="503"} 0
代码 1.3
2. 数据指标(metric)
代码 1.3 中给出了一个示例,Prometheus 拉取回的数据,就是上述这种格式的。我们对这种格式,做一个抽象定义的话,就是如下形式
metric_name{label_name1=label_value1, ...} float_value以空格为分割,前半部分就是指标,后半部分就是指标的值。指标又分为指标名称和指标标签,大括号内容中的内容就是一个个指标标签,可以理解为对于当前指标的各种属性描述信息;指标名称就是大括号前的 metric_name,可以在后续的所有查询操作中,都需要根据这个名字作为检索依据。
我们打开 http://localhost:9090/graph ,在其中搜索框中输入
promhttp_metric_handler_requests_total
后回车,会显示出来当前不同 HTTP 请求响应码的个数统计:
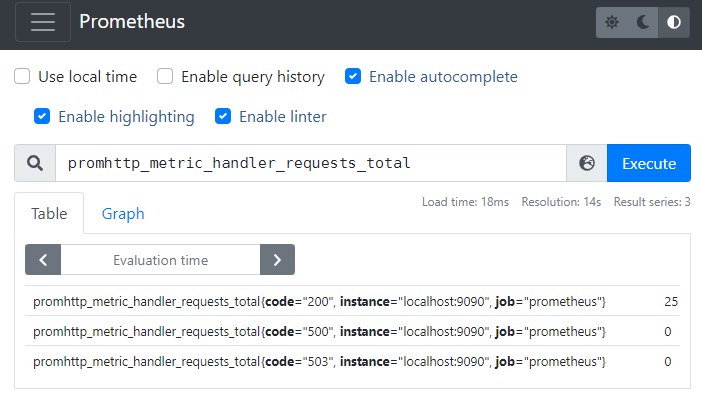
图 2.1
当然你也可以在检索中通过标签值来做过滤,比如说你只想看请求响应码为 200 的数据。输入
promhttp_metric_handler_requests_total{code="200"}
后回车,会显示如下数据:
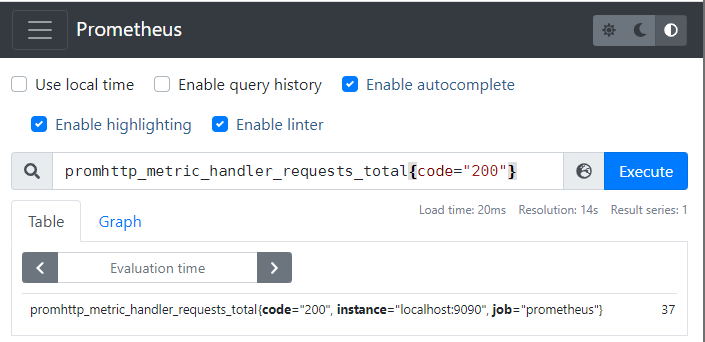
图 2.2
上面举的两个例子返回的都是当前最新时刻的数据,如果我们想查看最近一段时间的数据,可以加一个 duration,
metric_name{label_name1=label_value1, ...}[duration]例如我们要显示最近 1 分钟内所有的 promhttp_metric_handler_requests_total 指标,可以输入 promhttp_metric_handler_requests_total[1m]:
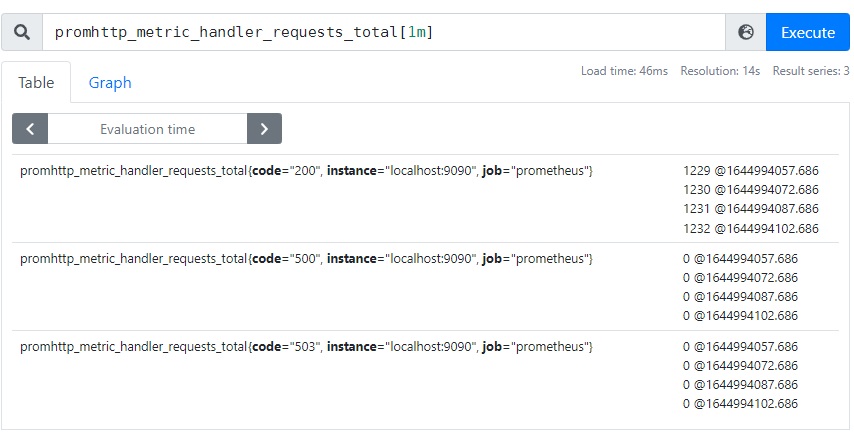
图 2.3
由于要返回一段时间内的多条数据,所以每个数据的值后面又标识上了时间戳,比如说第一行数据 1229 @ 164994057.686 代表在时间戳 164994057.686 搜刮上来的 HTTP 响应码为 200 的请求计数为 1229 个。将第二行的时间戳和第一行的时间戳相减,即 1644988807.686 - 1644988822.686, 得到的值为 15,代表当前 Prometheus 搜刮 http://localhost:9090/metrics 的时间间隔为 15s,这个时间间隔也是 Prometheus 的默认值。
通过上面的例子可以推断出来,Prometheus 不仅仅存储了当前指标的最新值,并且还存储了历史值,这样通过一段时间的历史数据,就给指标的变化曲线的绘制操作提供了数据支持。
Prometheus 每次进行搜刮的时候,都会将搜刮到的各种指标添加一个时间戳字段,然后存储到本地。如下图所示,图中的每个圆点代表搜刮的来的指标内容。一个个的小圆点组成了一个类似矩阵的结构,矩阵的每一行都是具体某个指标在各个时间点上的取值;矩阵的每一列的时间戳属性都是同一个值。列与列之间的间隔就是 Prometheus 的搜刮的时间间隔。
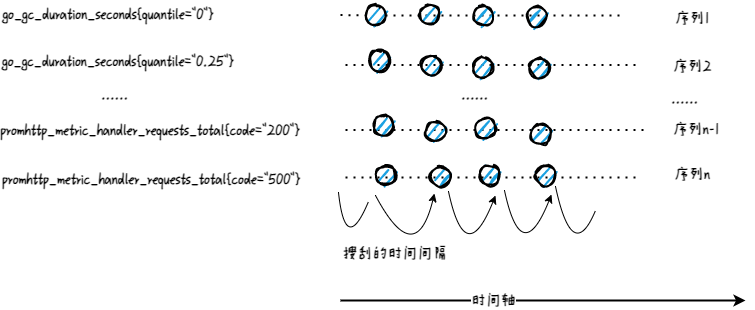
图 2.4
Prometheus 对于 图 2.1 中的查询语句,叫做瞬时向量查询(Instant vector selectors),但是它返回的仅仅是命中查询语句的所有指标的最新值。比如 图 2.1 中一共命中了三个指标,但是均返回每个指标的最新值。图 2.2 中增加了对于 label 的限定,它返回的依然是查询到每个指标的最新值,也就是说它也归属于瞬时向量的范畴。
从数学意义上讲,它更像是点,而不是向量,虽然数学中可以允许只有一个点的向量存在。
Prometheus 对于 图 2.3 中的查询语句,叫做区间向量查询(Range Vector Selectors),它跟瞬时向量不同的是,它能返回多个点,确切的说是从当前时刻往前推 duration 时间段内的多个点(对于 图 2.3 来说,duration 为 1分钟)。类似于 图 2.2 ,你可以可以对 图 2.3 中的查询添加 label 限定。
同时留意到我们在 图 2.1 使用的指标 promhttp_metric_handler_requests_total 在 Prometheus 中属于计数器(Counter)类型,它只能单调递增,我们一般用其来进行计数,比如说记录某个接口的请求次数。
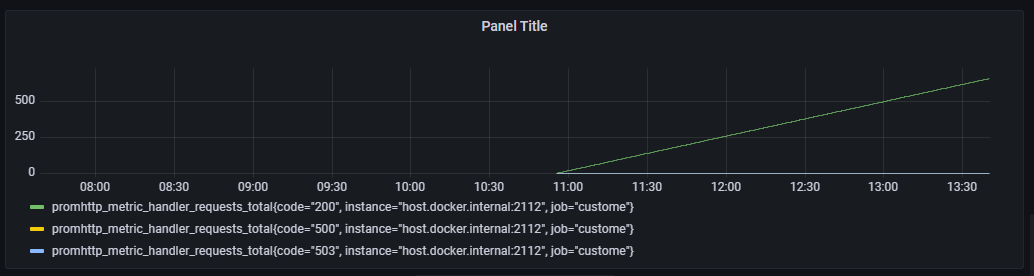
图 2.5
下面是一个使用 go 语言来暴漏计时器数据的代码示例:
package main

import (
	"net/http"
	"time"

	"github.com/prometheus/client_golang/prometheus"
	"github.com/prometheus/client_golang/prometheus/promauto"
	"github.com/prometheus/client_golang/prometheus/promhttp"
)

func recordMetrics() {
	go func() {
		for {
			opsProcessed.Inc()
			time.Sleep(2 * time.Second)
		}
	}()
}

var (
	opsProcessed = promauto.NewCounter(prometheus.CounterOpts{
		Name: "myapp_processed_ops_total",
		Help: "The total number of processed events",
	})
)

func main() {
	recordMetrics()

	http.Handle("/metrics", promhttp.Handler())
	http.ListenAndServe(":2112", nil)
}
代码 2.1
现实场景中,很多数据并不是单调递增的,比如操作系统中内存、CPU 资源的使用,不同时间点上数值上下波动是很正常的。在 Prometheus 中这种数据类型,适合用仪表盘(Guage)来进行处理。

图 2.6
下面是一个使用仪表盘的 go 示例代码:
package main

import (
	"net/http"
	"time"
	"math/rand"
	"github.com/prometheus/client_golang/prometheus"
	"github.com/prometheus/client_golang/prometheus/promhttp"
)

func main() {
	opsQueued := prometheus.NewGauge(prometheus.GaugeOpts{
		Namespace: "our_company",
		Subsystem: "blob_storage",
		Name:      "ops_queued",
		Help:      "Number of blob storage operations waiting to be processed.",
	})
	prometheus.MustRegister(opsQueued)
	go func() {
		for {
			num := rand.Intn(10)
			if num > 5 {
				opsQueued.Add(float64(num) - 5)
			} else {
				opsQueued.Sub(float64(num))
			}

			time.Sleep(2 * time.Second)
		}
	}()

	http.Handle("/metrics", promhttp.Handler())
	http.ListenAndServe(":2112", nil)
}
代码 2.2
再考虑这么一种场景,就是你在记录响应时间数据时,希望对于当前服务的响应时间有一个估算值,在某些极端情况下,服务器确实会出现响应超长的情况,你想在查看的时候能够将这些异常值和正常值区分开。一个比较好的方法就是绘制直方图,将不同响应时间区间内的数据分开展示出来。Prometheus 中直接就含有直方图(Histogram)的指标类型。借助于 grafana,我们能够呈现出如下的图形,方便查阅
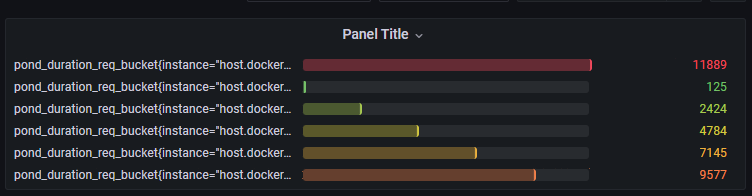
图 2.7
对应的数据生成的 go 代码如下:
package main

import (
	"math/rand"
	"net/http"
	"time"

	"github.com/prometheus/client_golang/prometheus"
	"github.com/prometheus/client_golang/prometheus/promhttp"
)

func main() {
	durations := prometheus.NewHistogram(prometheus.HistogramOpts{
		Name:    "pond_duration_req",
		Help:    "The duration of request process.", // Sorry, we can't measure how badly it smells.
		Buckets: prometheus.LinearBuckets(0, 0.2, 5),  // 5 buckets, each 0.2 centigrade wide.
	})
	prometheus.MustRegister(durations)
	go func() {
		for {
			rand.Seed(time.Now().UnixNano()) //设置随机种子,使每次结果不一样
			i := float64(rand.Intn(100)) / 100
			durations.Observe( i)

			time.Sleep(1 * time.Second)
		}
	}()

	http.Handle("/metrics", promhttp.Handler())
	http.ListenAndServe(":2112", nil)
}
代码 2.3
注意,虽然在代码中指定的指标名字为 pond_duration_req,在 Prometheus 中存储的时候,会被转为 pond_duration_req_bucket 这个名字。
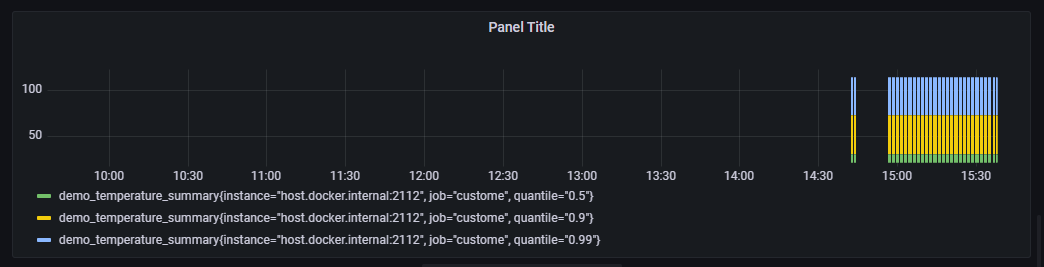
和直方图类似,摘要(Summary)也提供了数据聚合功能,不过它是将数据按照百分比进行聚合,比如说占总量 50% 的数据有多少,占总量 90% 的数据有多少。
package main

import (
	"net/http"
	"math"
	"time"
	"github.com/prometheus/client_golang/prometheus"
	"github.com/prometheus/client_golang/prometheus/promhttp"
)

func main() {
	temps := prometheus.NewSummary(prometheus.SummaryOpts{
		Name:       "demo_temperature_summary",
		Help:       "The temperature of the frog pond.",
		Objectives: map[float64]float64{0.5: 0.05, 0.9: 0.01, 0.99: 0.001},//每个百分比计算的允许误差
	})
	prometheus.MustRegister(temps)
	go func() {
		// Simulate some observations.
		for {
			for i := 0; i < 1000; i++ {
				temps.Observe(30 + math.Floor(120*math.Sin(float64(i)*0.1))/10)
			}

			time.Sleep(1 * time.Second)
		}

	}()

	http.Handle("/metrics", promhttp.Handler())
	http.ListenAndServe(":2112", nil)
}
代码 2.4
3. 使用 grafana 展示数据
第二小节已经展示了若干 grafana 中图标,这一小节讲述 grafana 的具体配置。首先选择配置按钮,然后选择 Data Sources 菜单,接着点击 Add data source 按钮,再打开的列表中选择 Prometheus 选项。
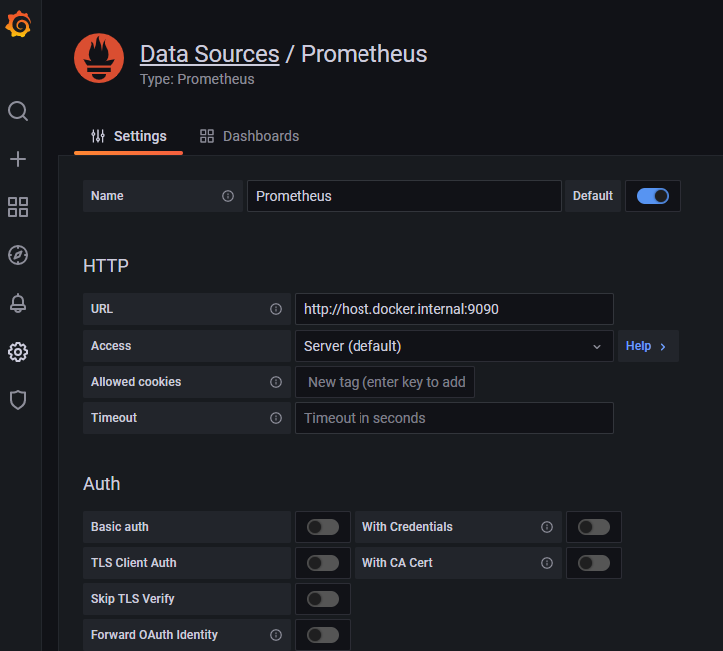
图 3.1
在 URL 栏填写正确的 Prometheus 的访问地址,默认情况下这个输入框中会显示一个值为 http://localhost:9090 的 placeholder,即使你当前 Prometheus 的访问地址确实是 http://localhost:9090,依然要填写上一遍,否则该值就是空的。
最后把滚动条拉到最后,点击按钮 Save & test,正常情况下会提示成功。
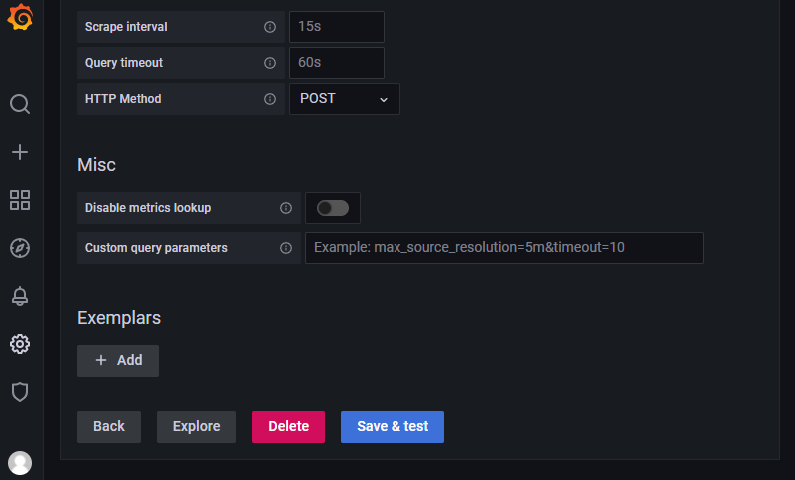
图 3.2
接着选择 + 按钮,然后选择 Dashboard,然后选择 Add a new panel,然后在 Metrics browser 输入框中填入一个 Prometheus 中的立即向量表达式,比如说 pond_duration_req_bucket{instance="host.docker.internal:2112"},默认情况下图表会以时间线的形式显示出来,如 图3.5 所示。当然你也可以在右上角下拉选择不同的图标展示模式,如 图 3.6 所示。
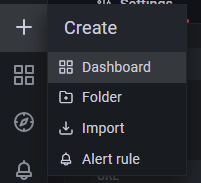
图 3.3

图 3.4
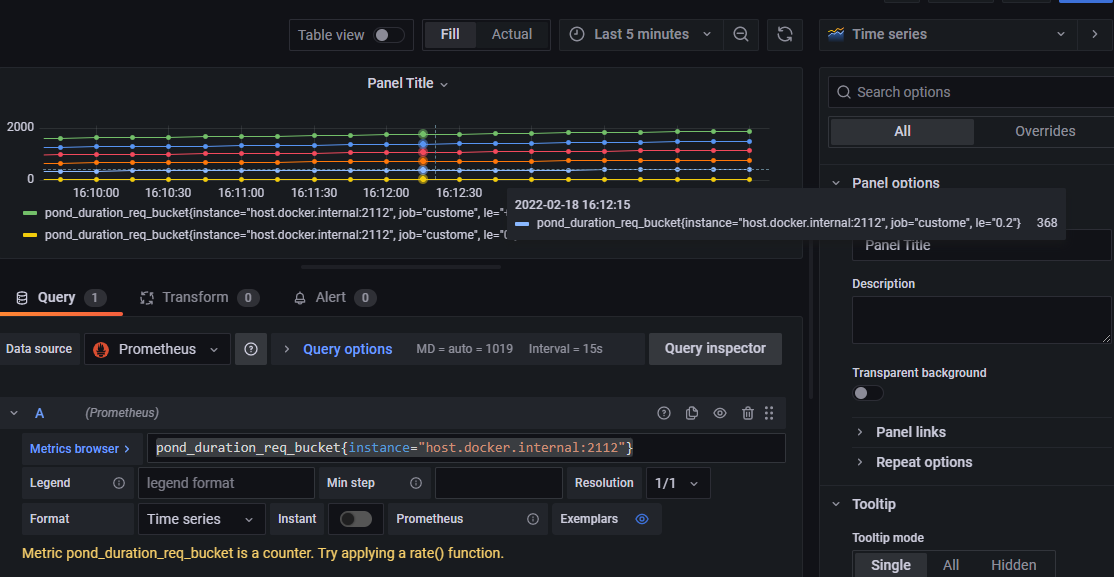
图 3.5
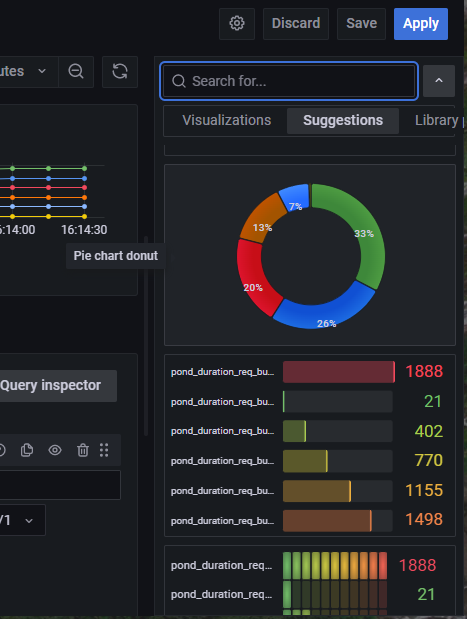
图 3.6
参考资料
- Prometheus Cheat Sheet - Basics (Metrics, Labels, Time Series, Scraping) https://iximiuz.com/en/posts/prometheus-metrics-labels-time-series/
代码
本教程代码可以从这里找到 https://gitee.com/yunnysunny/prometheus-learn